UNDERSTANDING
- Sampling techniques are used to estimate population size
- The exponential growth pattern occurs in an ideal, unlimited environment
- Population growth slows as a population reaches the carrying capacity of the environment
- The phases shown in the sigmoid curve can be explained by relative rates of natality, mortality, immigration and emigration
- Limiting factos can be top-down or bottom-up
APPLICATIONS
-Evaluating the methods used to estimate the size of commercial stock of marine resources
- Use the capture-mark-release-recapture ethos to estimate the populate size of an animal species
- Discussion of the effect of natality, mortality, immigration and emigration on population size.
- Analysis of the effect of population size, age and reproductive status on sustainable fishing practices.
- Bottom-up control of algal blooms by shortage of nutrients and top-down control by herbivory
SKILLS
- Modeling the growth curving using a simple organism such as yeast or species of Lemma
ESTIMATING POPULATION SIZE
Sampling techniques are used to estimate population.
The simplest method of estimating population size or population density is to count the number of individuals in a given area. This is only feasible if the individuals are large and the area is small. For most other cases, ecologists use population sampling techniques. This requires the researcher to determine the population. This is referred to as population sampling. The sample is assumed to be representative of the entire population. Normally, several samples are taken to limit the effect of choosing a sample which is not representative.
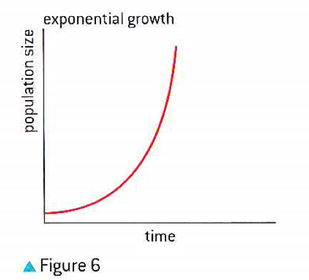
THE "J" SHAPED POPULATION GROWTH CURVE
The exponential growth pattern occurs in an ideal, unlimited environment.
If a population experiences ideal conditions, than the population will grow exponentially. A graph of population size over time will resemble a "J" shape
Sampling techniques are used to estimate population.
The simplest method of estimating population size or population density is to count the number of individuals in a given area. This is only feasible if the individuals are large and the area is small. For most other cases, ecologists use population sampling techniques. This requires the researcher to determine the population. This is referred to as population sampling. The sample is assumed to be representative of the entire population. Normally, several samples are taken to limit the effect of choosing a sample which is not representative.
THE "J" SHAPED POPULATION GROWTH CURVE
The exponential growth pattern occurs in an ideal, unlimited environment.
If a population experiences ideal conditions, than the population will grow exponentially. A graph of population size over time will resemble a "J" shape
FACTORS THAT INFLUENCE POPULATION SIZE.
The phases shown in the sigmoid curve can be explained by relative rates of natality, mortality, immigration and emigration.
With limited environmental resistance, a population will grow exponentially. At this stage birth rate (natality) is higher than death rate (mortality)
As population density increases, various density-dependent factors begin to limit population growth. Examples of such limiting facts include competition for resources, a build-up of the too by-products of metabolism, an increase in predation or an increase in the incidence of disease.
An important variable affecting population size is migration.
Immigration increases the size of a population. As an example, an island that is close to the mainland will most likely have regular replenishment of a population through immigration.
Emigration decreases the size of a population. Emigration occurs when population members leave an area. The Norway lemming is renowned for its emigration patterns from areas of high population density or poor habitat. This occurs in seasons with high population levels.
CARRYING CAPACITY
Population growth slows as a population reaches the carrying capacity of the environment.
The maximum size of a population that an environment can support is its carrying capacity. It is represented by the variable "K". In the sigmoid growth pattern, when a population reaches its carrying capacity, the population will stop growing and natality and mortality will be equal.
However, some years can see a "boom" and "bust" patter where populations far exceed the carrying capacity. Higher rates of mortality will return the population to the carrying capacity of the environment or the population may crash well below the carrying capacity.
TOP-DOWN AND BOTTOM-UP LIMITING FACTORS
Limiting factors can be top-down or bottom-up
A limiting factor is an environmental selection pressure that limits population growth. There are two categories of limiting factor: top-down and bottom-up.
The population of organisms in an ecosystem can be influences by the availability of resources such as nutrients, food and space. All such factors are referred to as bottom-up limiting factors
Predation is referred to as a top-down limiting factor
A keystone species exerts top-down influence on its community by preventing species at lower trophic levels from monopolizing critical resources, such as competition for space or food sources.
RESOURCES:
Allott, Andrew, and David Mindorff. Biology: Oxford IB Diploma Programme. N.p.: n.p., n.d. Print.
Allott, Andrew, and David Mindorff. Biology: Oxford IB Diploma Programme. N.p.: n.p., n.d. Print.
